Quality Evaluations
Previously you have created a Dynatrace dashboard and an API token.
Create a Secret for Dynatrace Connection Details
We need to store some data about the Dynatrace environment.
Modify and set the details appropriate for your environment.
The convention is either https://***.live.dynatrace.com for SaaS (no trailing slash) or https://{your-domain}/e/{your-environment-id} for managed (no trailing slash).
Yes: Keptn works with Managed. We will discuss considerations for SaaS vs. Managed later.
export DT_TENANT=https://{your-environment-id}.live.dynatrace.com
export DT_API_TOKEN=dtc01.****
Create the secret either programatically or using the bridge UI:
keptn create secret dynatrace --scope="dynatrace-service" --from-literal="DT_TENANT=$DT_TENANT" --from-literal="DT_API_TOKEN=$DT_API_TOKEN"
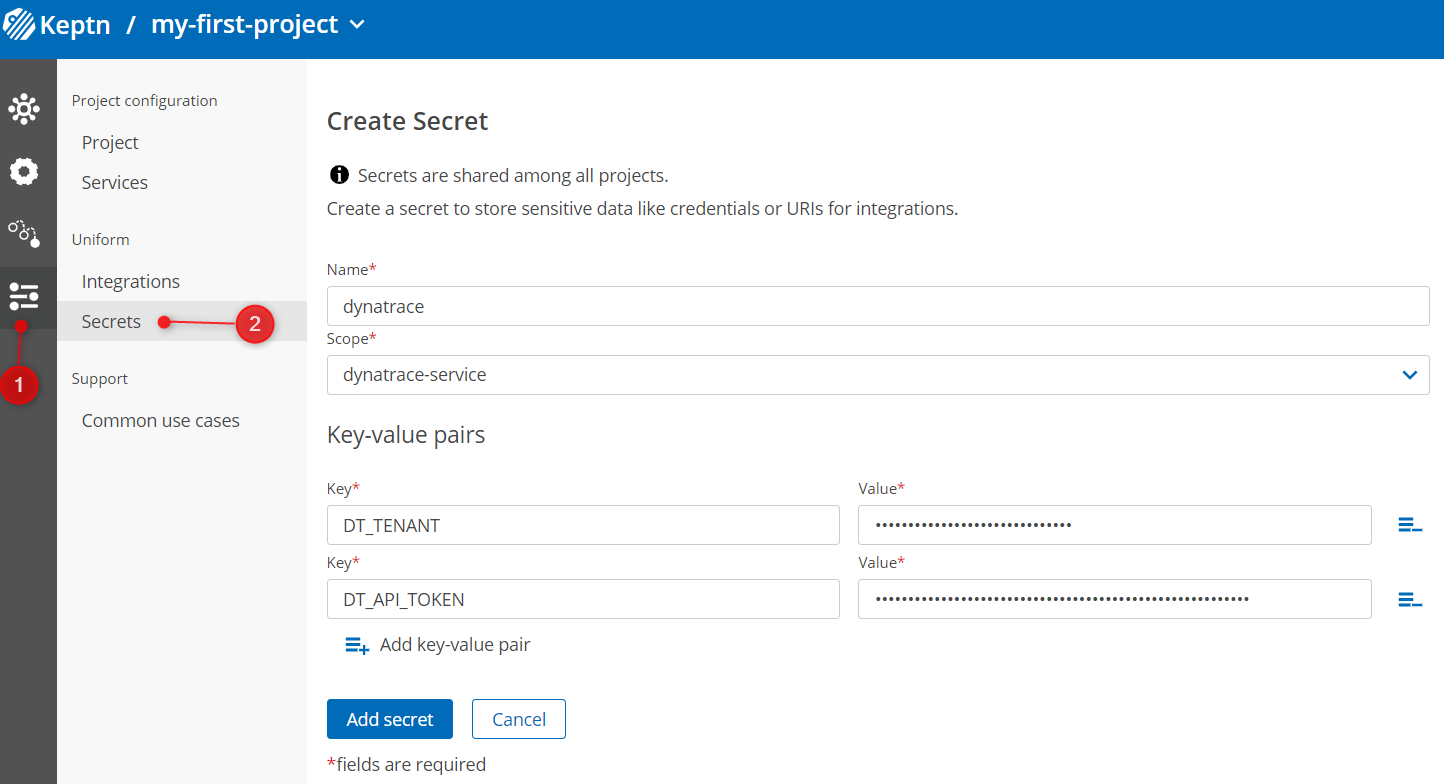
Whichever way you choose, the secret should now appear in Keptn:

Install Dynatrace Service
Please note: Cloud Automation already provides the Dynatrace service so this step can be skipped if using hosted Cloud Automation.
Natively, Keptn obviously does not know how to talk to, retrieve data or push data to third party tools such as Dynatrace. Hence we need to install the Keptn Dynatrace Service. This microservice contains all of the logic about how to interact with, retrieve data, push events to and create configuration with Dynatrace.
Keptn is not opinionated on tooling and equivalent services exist for Prometheus and Datadog (and you can write your own to interact with any other backend you want).
Gather and set some details of your Keptn environment. Obviously use YOUR IP address here (no trailing slash!)
export KEPTN_ENDPOINT=http://1.2.3.4
export KEPTN_BRIDGE=http://1.2.3.4/bridge
Install the Dynatrace service:
helm upgrade --install dynatrace-service -n keptn \
https://github.com/keptn-contrib/dynatrace-service/releases/download/0.22.0/dynatrace-service-0.22.0.tgz \
--set distributor.image.tag=0.15.1 \
--set dynatraceService.config.keptnApiUrl=$KEPTN_ENDPOINT \
--set dynatraceService.config.keptnBridgeUrl=$KEPTN_BRIDGE_URL

Configure project to use Dynatrace
Tell Keptn to use Dynatrace monitoring for this project:
keptn configure monitoring dynatrace --project my-first-project
This creates a ConfigMap in keptn that the lighthouse service uses to understand which monitoring provider it should use.
View it with kubectl -n keptn get configmap lighthouse-config-my-first-project -o yaml
Tell Dynatrace Service Which Dashboard To Look For
The Dynatrace service configuration is installed and knows which tenant to look for, but it doesn’t know which dashboard to retrieve metrics from or which secret to use (the secret called dynatrace created above).
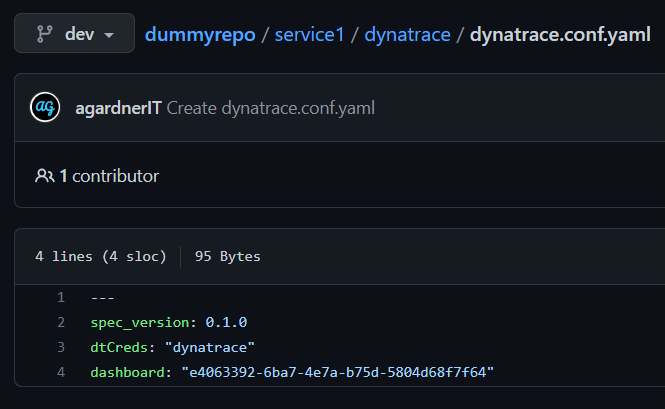
These things are configured in the Git repository in a special file called dynatrace.conf.yaml.
On the dev branch inside the service1 folder, create a new folder called dynatrace and inside there, create a file called dynatrace.conf.yaml with the following content:
---
spec_version: 0.1.0
dtCreds: dynatrace
dashboard: <YourDashboardIDHere>
Add Evaluation to Your Sequence
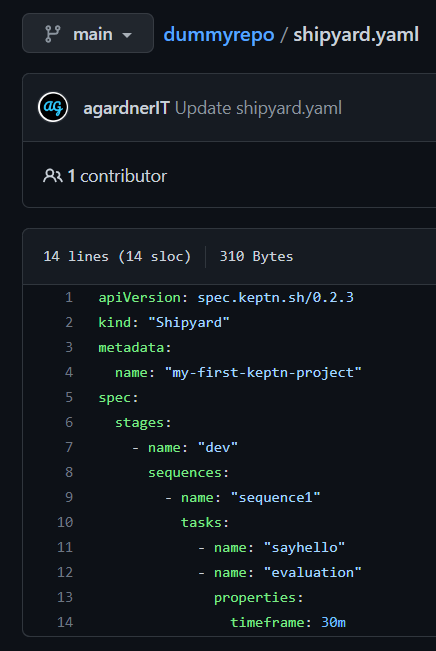
Switch back to main in Git and modify the shipyard to add another task:
apiVersion: spec.keptn.sh/0.2.3
kind: "Shipyard"
metadata:
  name: "my-first-keptn-project"
spec:
  stages:
    - name: "dev"
      sequences:
        - name: "sequence1"
          tasks:
            - name: "sayhello"
            - name: "evaluation"
              properties:
                timeframe: 30m
Trigger Sequence
Trigger the sequence1 sequence again just as you have always done.
This time your shell script sayhello task will execute. You will receive a notification to webhook.site when that task is finished. When that is done a quality gate evaluation will automatically run.
The Keptn dynatrace service will reach into Dynatrace and pull metrics from the nominated dashboard.
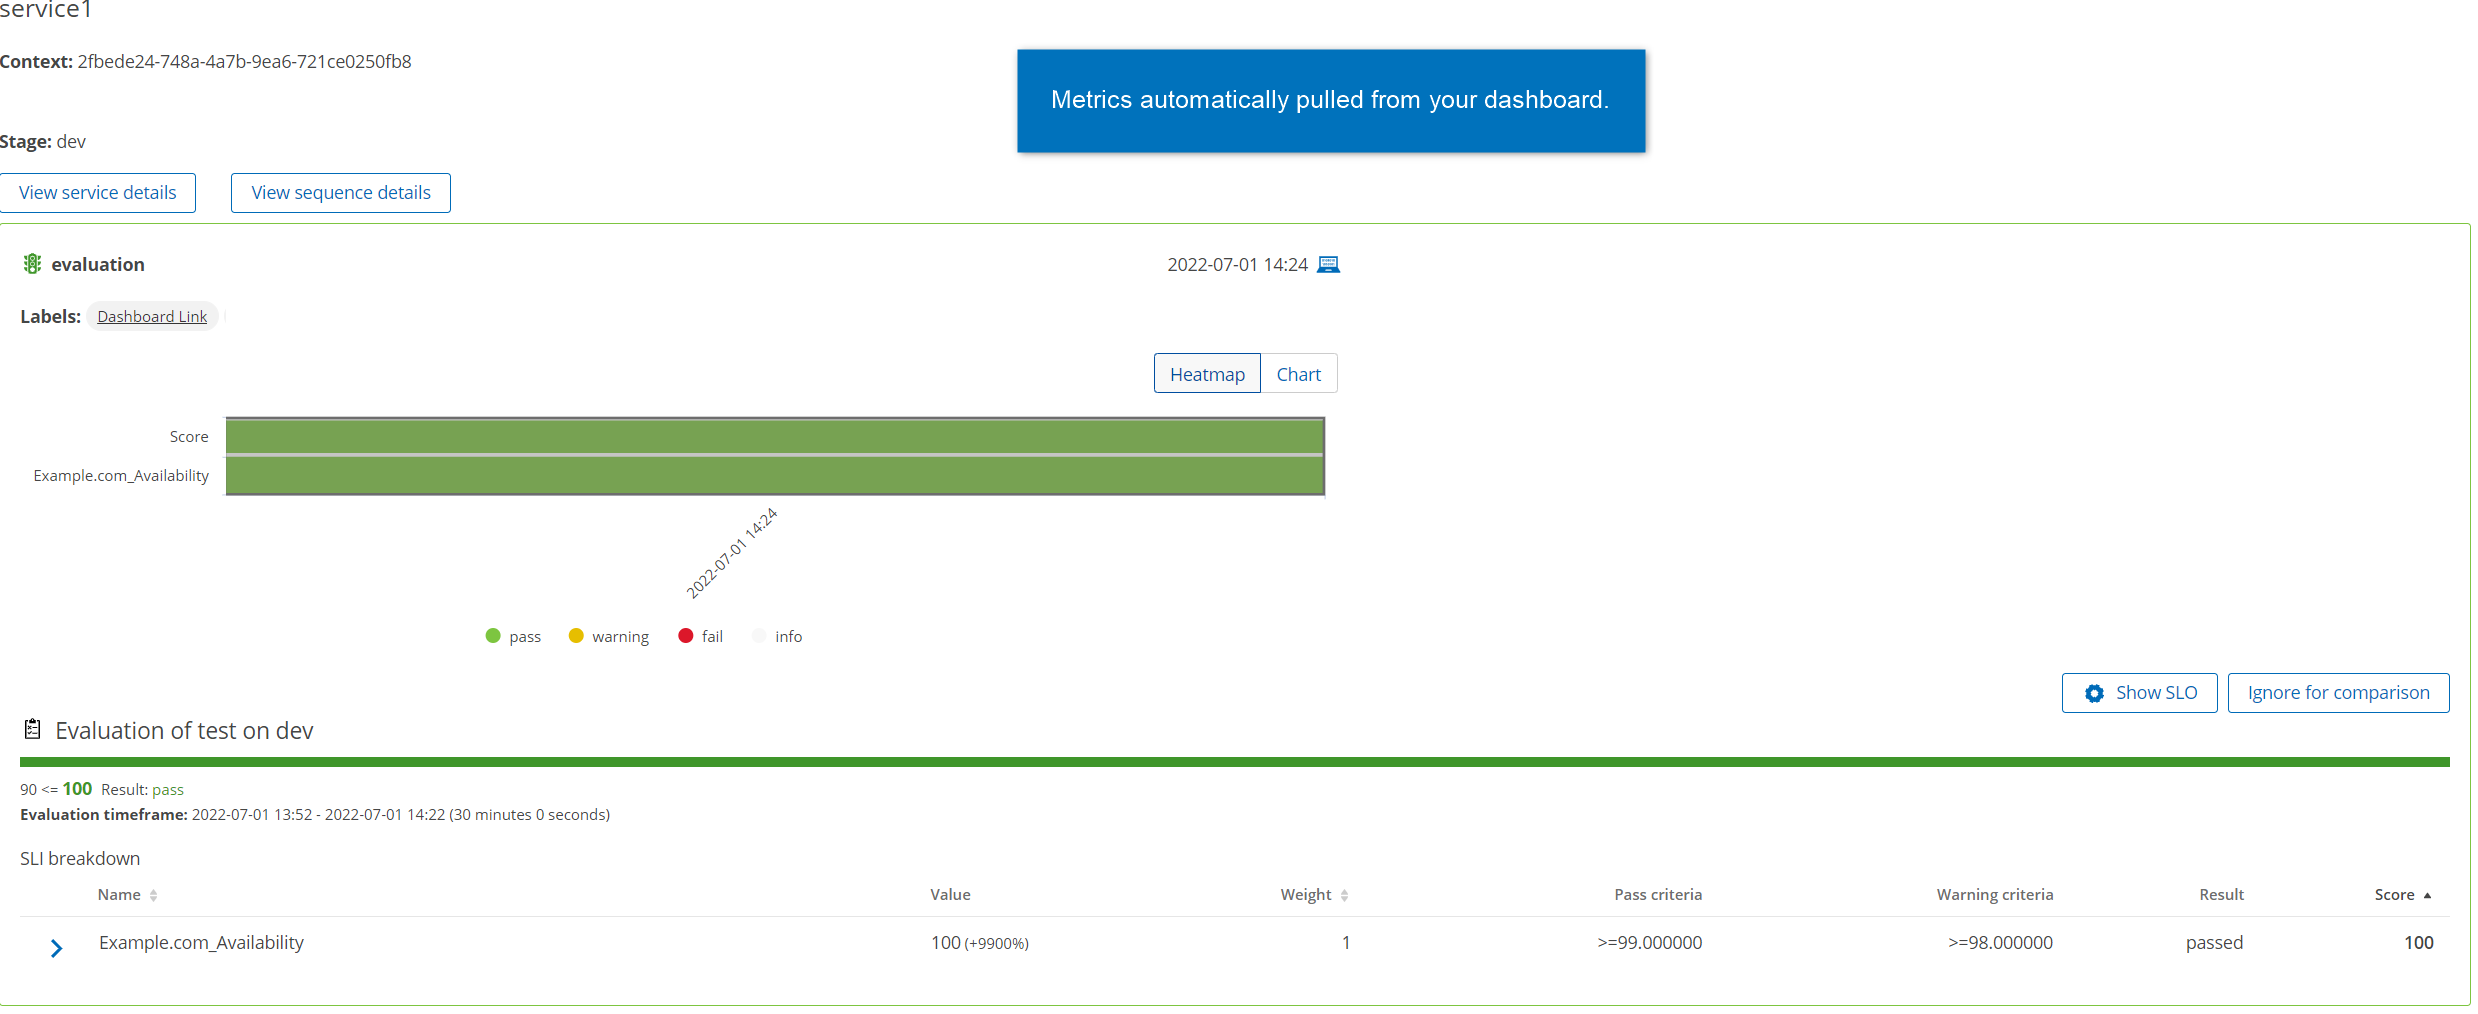
Exercise: Why Is Keptn Only Retrieving One Metric When Two Tiles are Present?
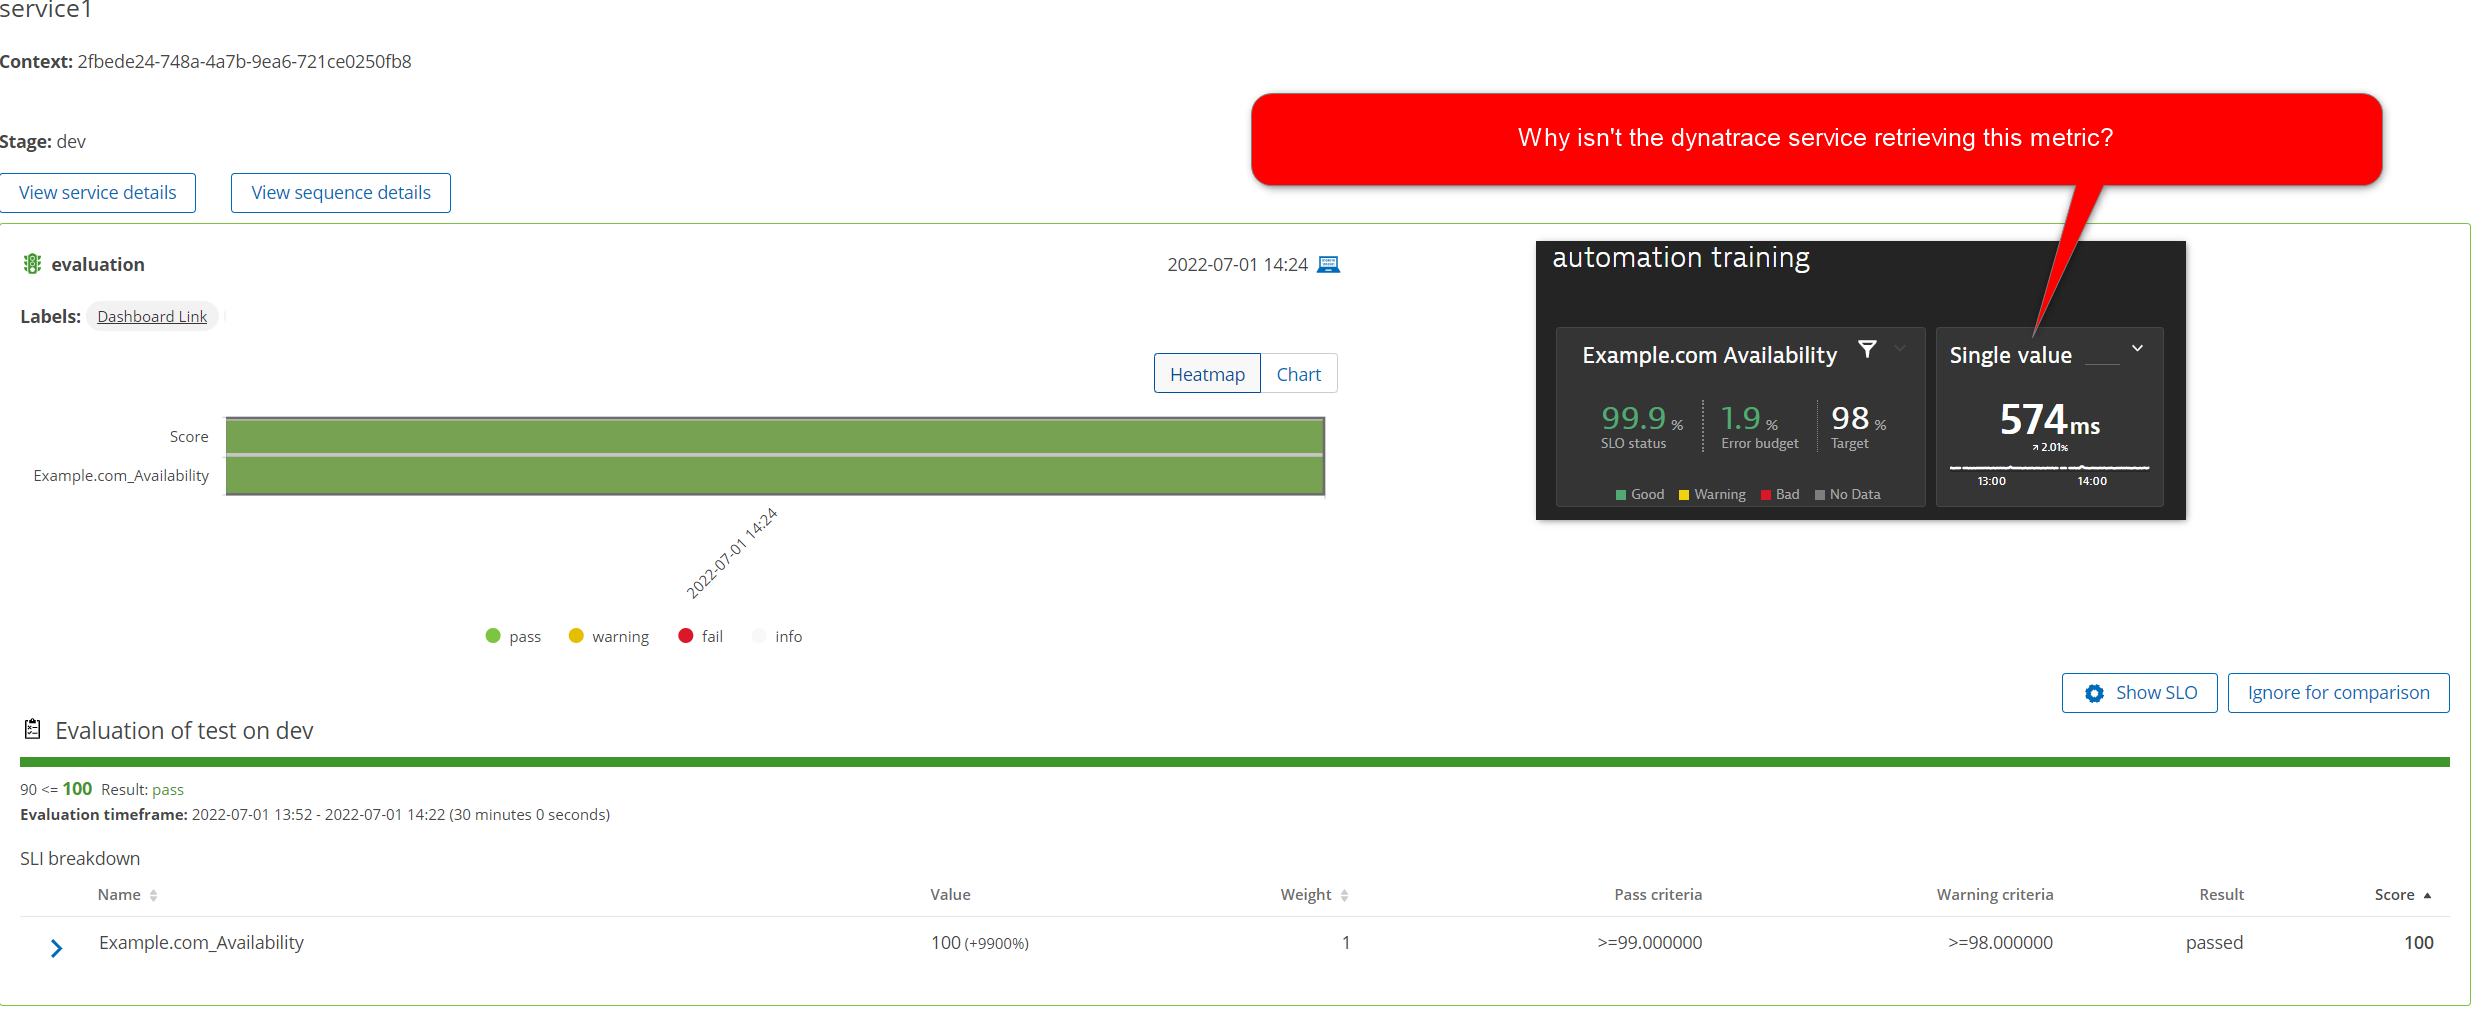
In your groups, resolve this issue.
Troubleshooting: Unknown Space Aggregation
Because Keptn is a collection of microservices, some provided by the core team and others provided by the community, it is important to be able to identify which component is erroring.
If the sequence failed and you received the following message:
Data Explorer tile could not be converted to a metric query: unknown space aggregation:
Start by identifying which component (or microservice) is broken. Do that by expanding the tasks and see which service responded to the triggered event. That will most likely be your culprit.
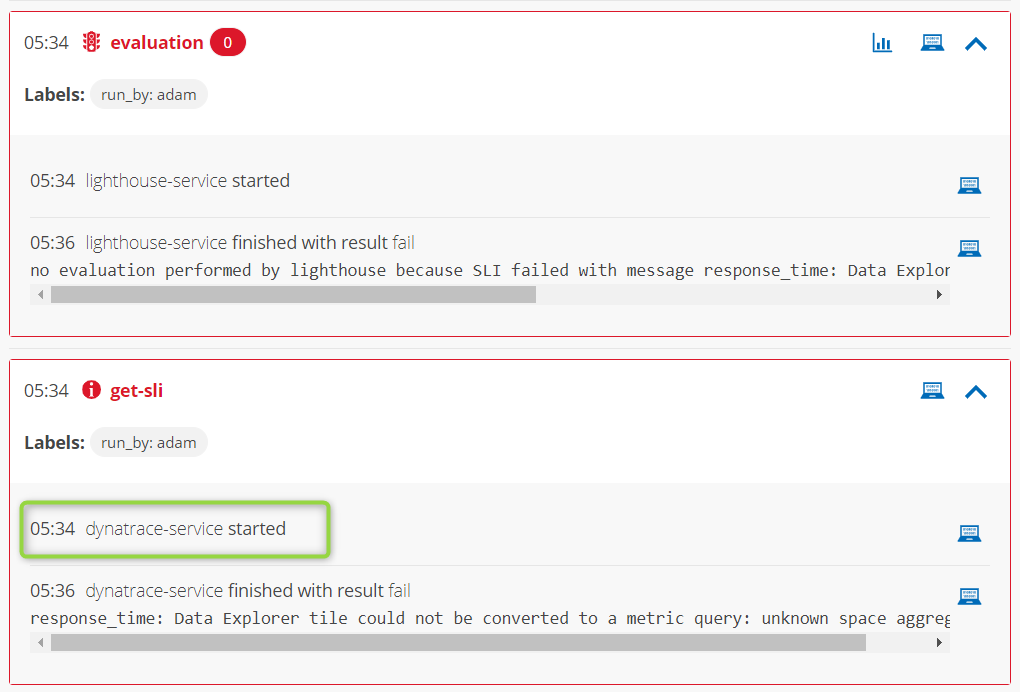
99% of the time you’ll have one task failing and thus one answer. In this case however, the architecture is slightly more complex.
When we request an evaluation, the lighthouse-service responds and the first thing it does is issue a get-sli.triggered event. In our case we’re using Dynatrace so the dynatrace-service responds to that get-sli.triggered event, reaches out to Dynatrace and retrieves metrics from the dashboard.
Thus in this case, although more complex. It is the dynatrace service that is at fault here.
A little bit of experimentation shows that tiles with the aggregation set to Auto will cause this error. The dynatrace service must not (yet) support the Auto aggregation.
To resolve, set the tile aggregation to Avg (or whatever else you like except Auto).
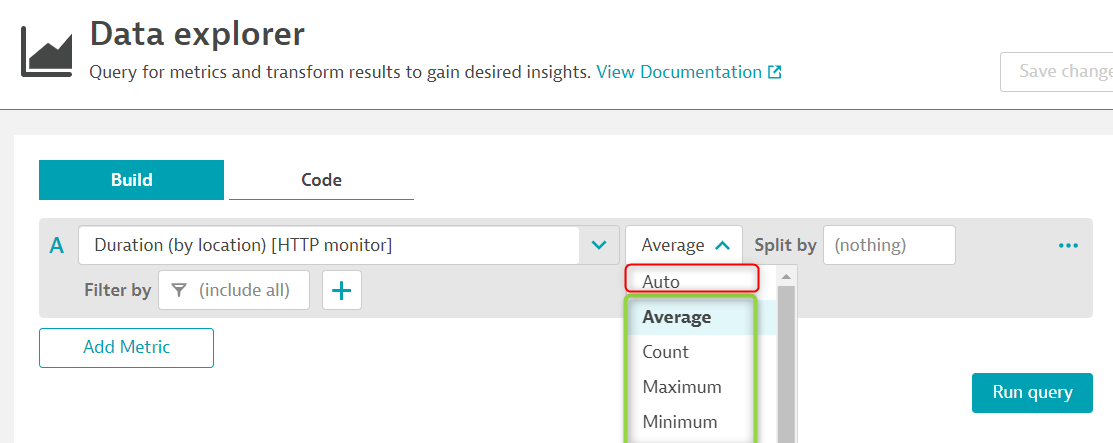
Of course, this being open source, you should either fix this in the code and create a Pull Request if you are able. Alternatively, mention this in Keptn Slack or raise an issue for the dynatrace-service so it can be fixed by another community member: https://github.com/keptn-contrib/dynatrace-service/issues
Exercise: Send Evaluation Results to Webhook.Site
Your customer needs the results of each evaluation in a third party tool like Slack, MS Teams or as a JIRA ticket.
Configure Keptn to send a webhook to your webhook.site endpoint every time an evaluation runs.
Ensure the evaluation result (pass, warning or fail) and score is included in the output.
Exercise: Dynamically Look Up Dashboard
The Dynatrace service is able to search a tenant for a dashboard. Reconfigure things so that rather than hardcoding a dashboard ID, it is retrieved dynamically.
Hint: The Dynatrace service documentation will help you.
Exercise: Evaluation Results in Dynatrace
Your customer wants the evaluation results to be attached to the example.com synthetic script. Reconfigure Dynatrace and / or the Keptn side to make this happen.
Hint: The Dynatrace service documentation will help you.
Exercise: SLI and SLO Files
When Dynatrace scrapes a dashboard it creates an sli.yaml and slo.yaml file automatically for you.
Explore these files to understand how they work.
Know that you can opt to not scrape a dashboard. Instead just manually create and add these files to the Git repo.
Do this now: Remove the references to a dashboard and instead, build the sli.yaml and slo.yaml files manually. It is important you know how to do this as, sooner or later, most customers will want to build their files programatically and not have to maintain a dashboard.
Exercise: Make Timeframe Dynamic
Currently, the evaluation timeframe is hardcoded at 30 minutes. Most likely you want some flexibility with that.
Keptn allows users to pass metadata in the body of a triggered event when using the API.
Do this now: Remove the following from the shipyard:
properties:
  timeframe 30m
and instead push that information via an API call that sends the triggered event (POSTman might help here).
Hint: The data block is your place, while there are some mandatory fields (data.project, data.service and data.stage) you are free to pass anything in the data block you wish. The syntax is to pass properties inside data.taskname
To trigger sequence1 and pass a timeframe property to the evaluation task, the triggered event would look like this:
curl -X POST 'http://<YourKeptn>/api/v1/event' ^
-H 'x-token: <KeptnAPIToken>' ^
-H 'Content-Type: application/json' ^
--data-raw '{
    "data": {
        "labels": {
            "run_by": "<you>"
        },
        "project": "my-first-project",
        "service": "service1",
        "stage": "dev",
        "evaluation": {
            "timeframe": "1h"
        }
    },
    "source": "postman",
    "type": "sh.keptn.event.dev.sequence1.triggered",
    "specversion": "1.0",
    "shkeptnspecversion": "0.2.3"
}'
